Architecture & Composability
What You Group is What You See
AUTHOR
Frank Corrigan

Group by is everywhere.
Every spreadsheet. Every dashboard. Every script.
In Excel, it’s a pivot table.
In SQL, an aggregation.
In Python:
df.groupby("category")["value"].mean() |
It hides in plain sight.
Too familiar to notice.
But when used intentionally, it’s a superpower.
That power comes from picking the right groups.
Group sales by region: East is thriving.
Group by customer: one whale accounts for 60% of East’s revenue. Same data, opposite stories.
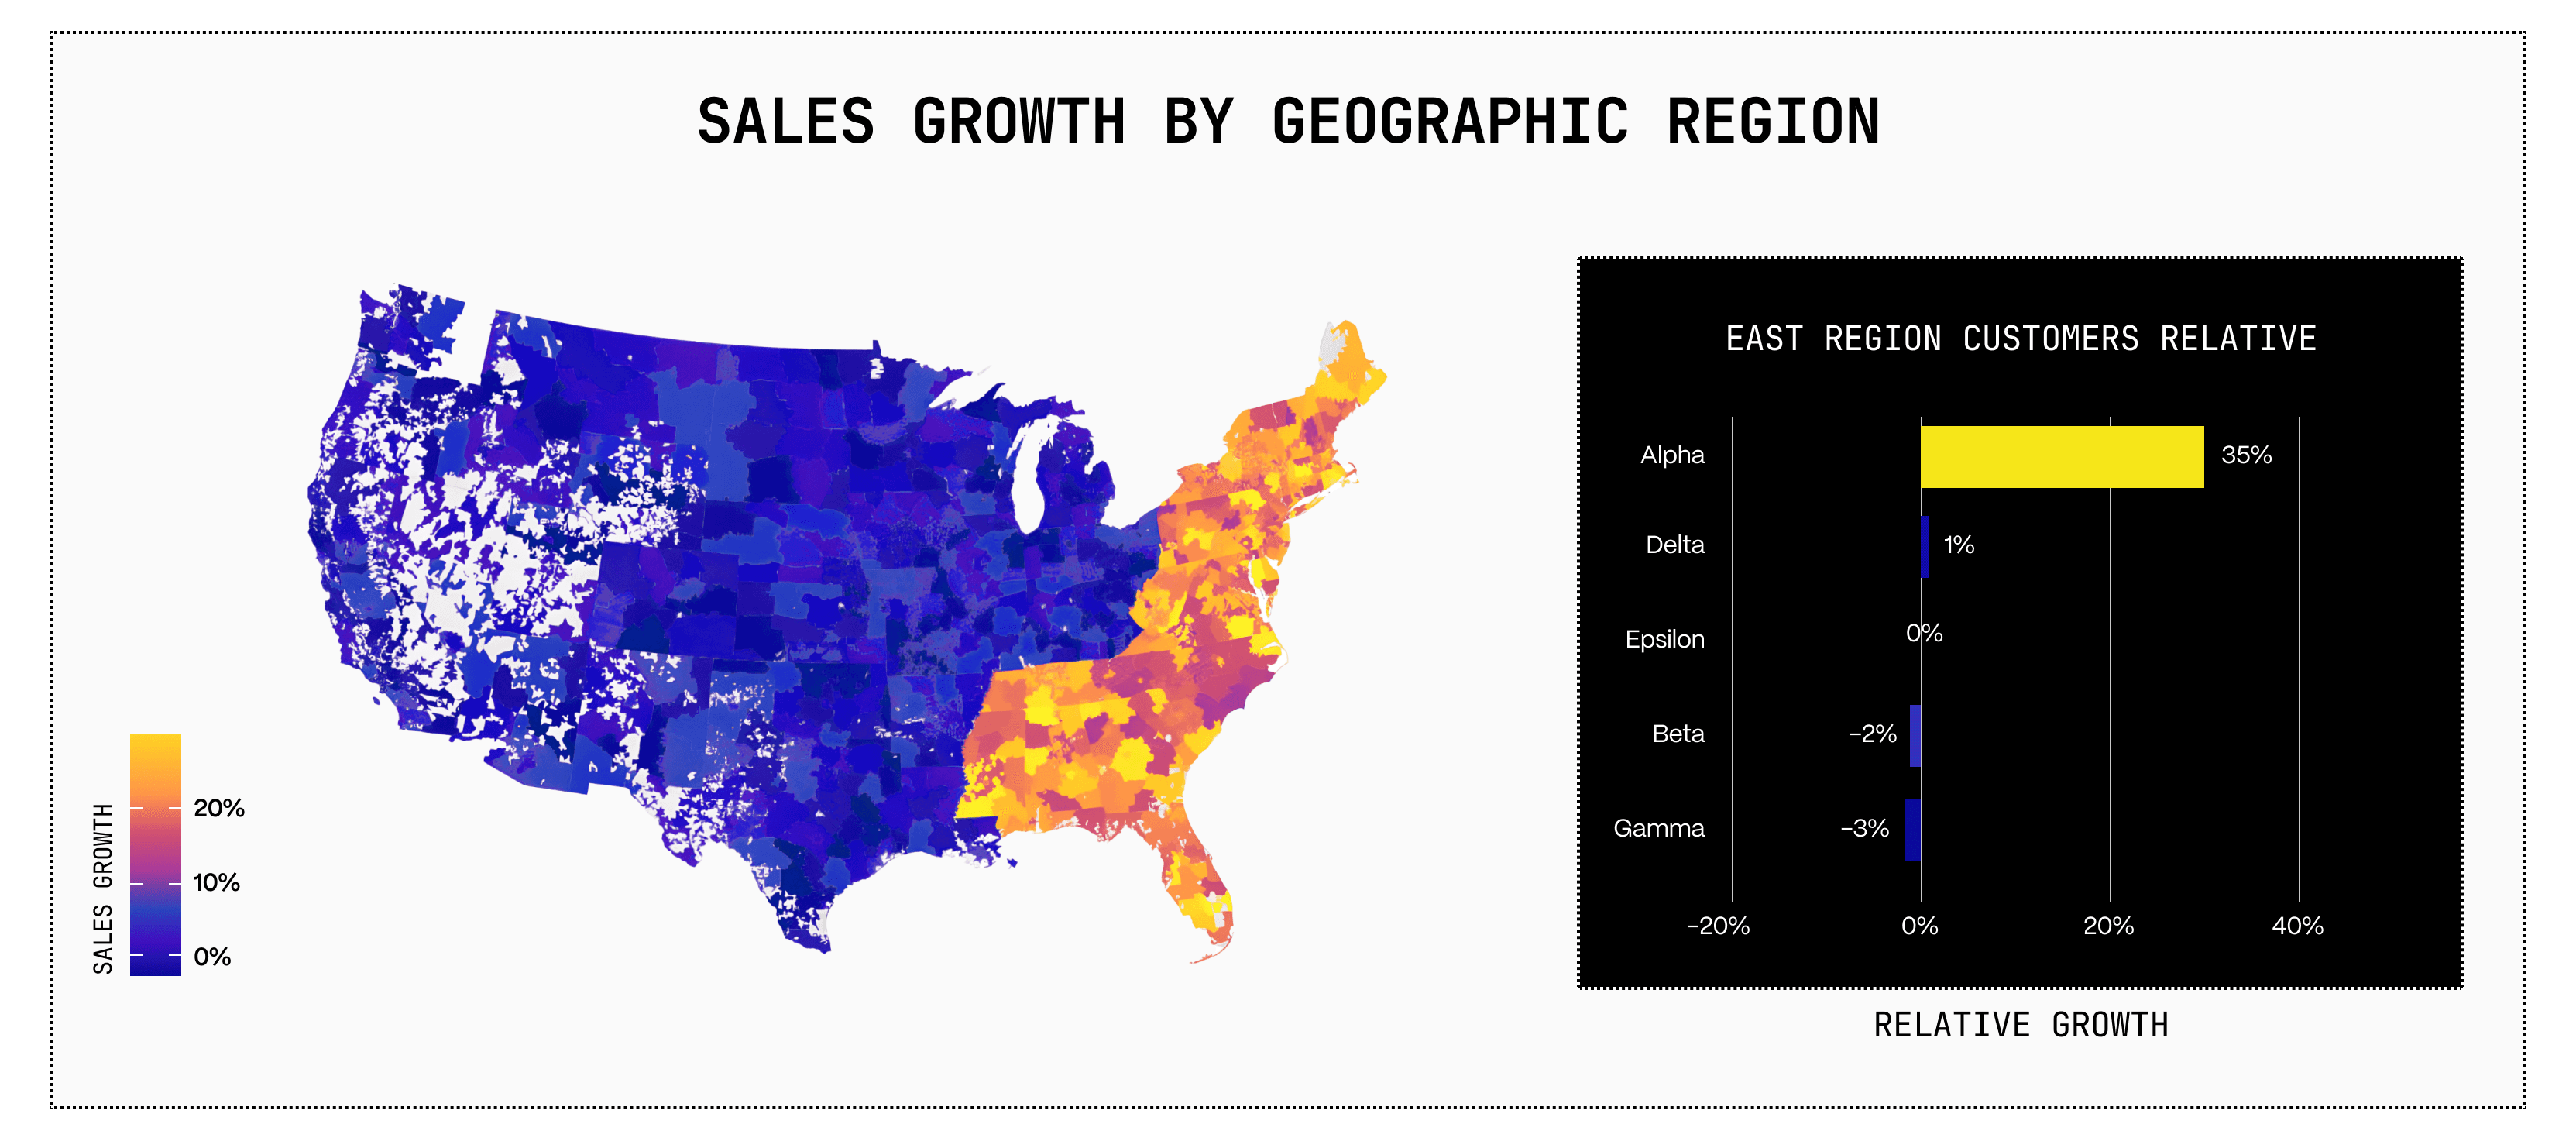
The frame decides the truth you see.
Grouping is the act of choosing that frame.
Find the right groups, reveal the insight.
Anyone can run the code.
The skill is judgement.
Judgement is choosing what belongs together.
In operations, my teams used facet grids all the time.
Multiple panels of the same chart type over different groupings.
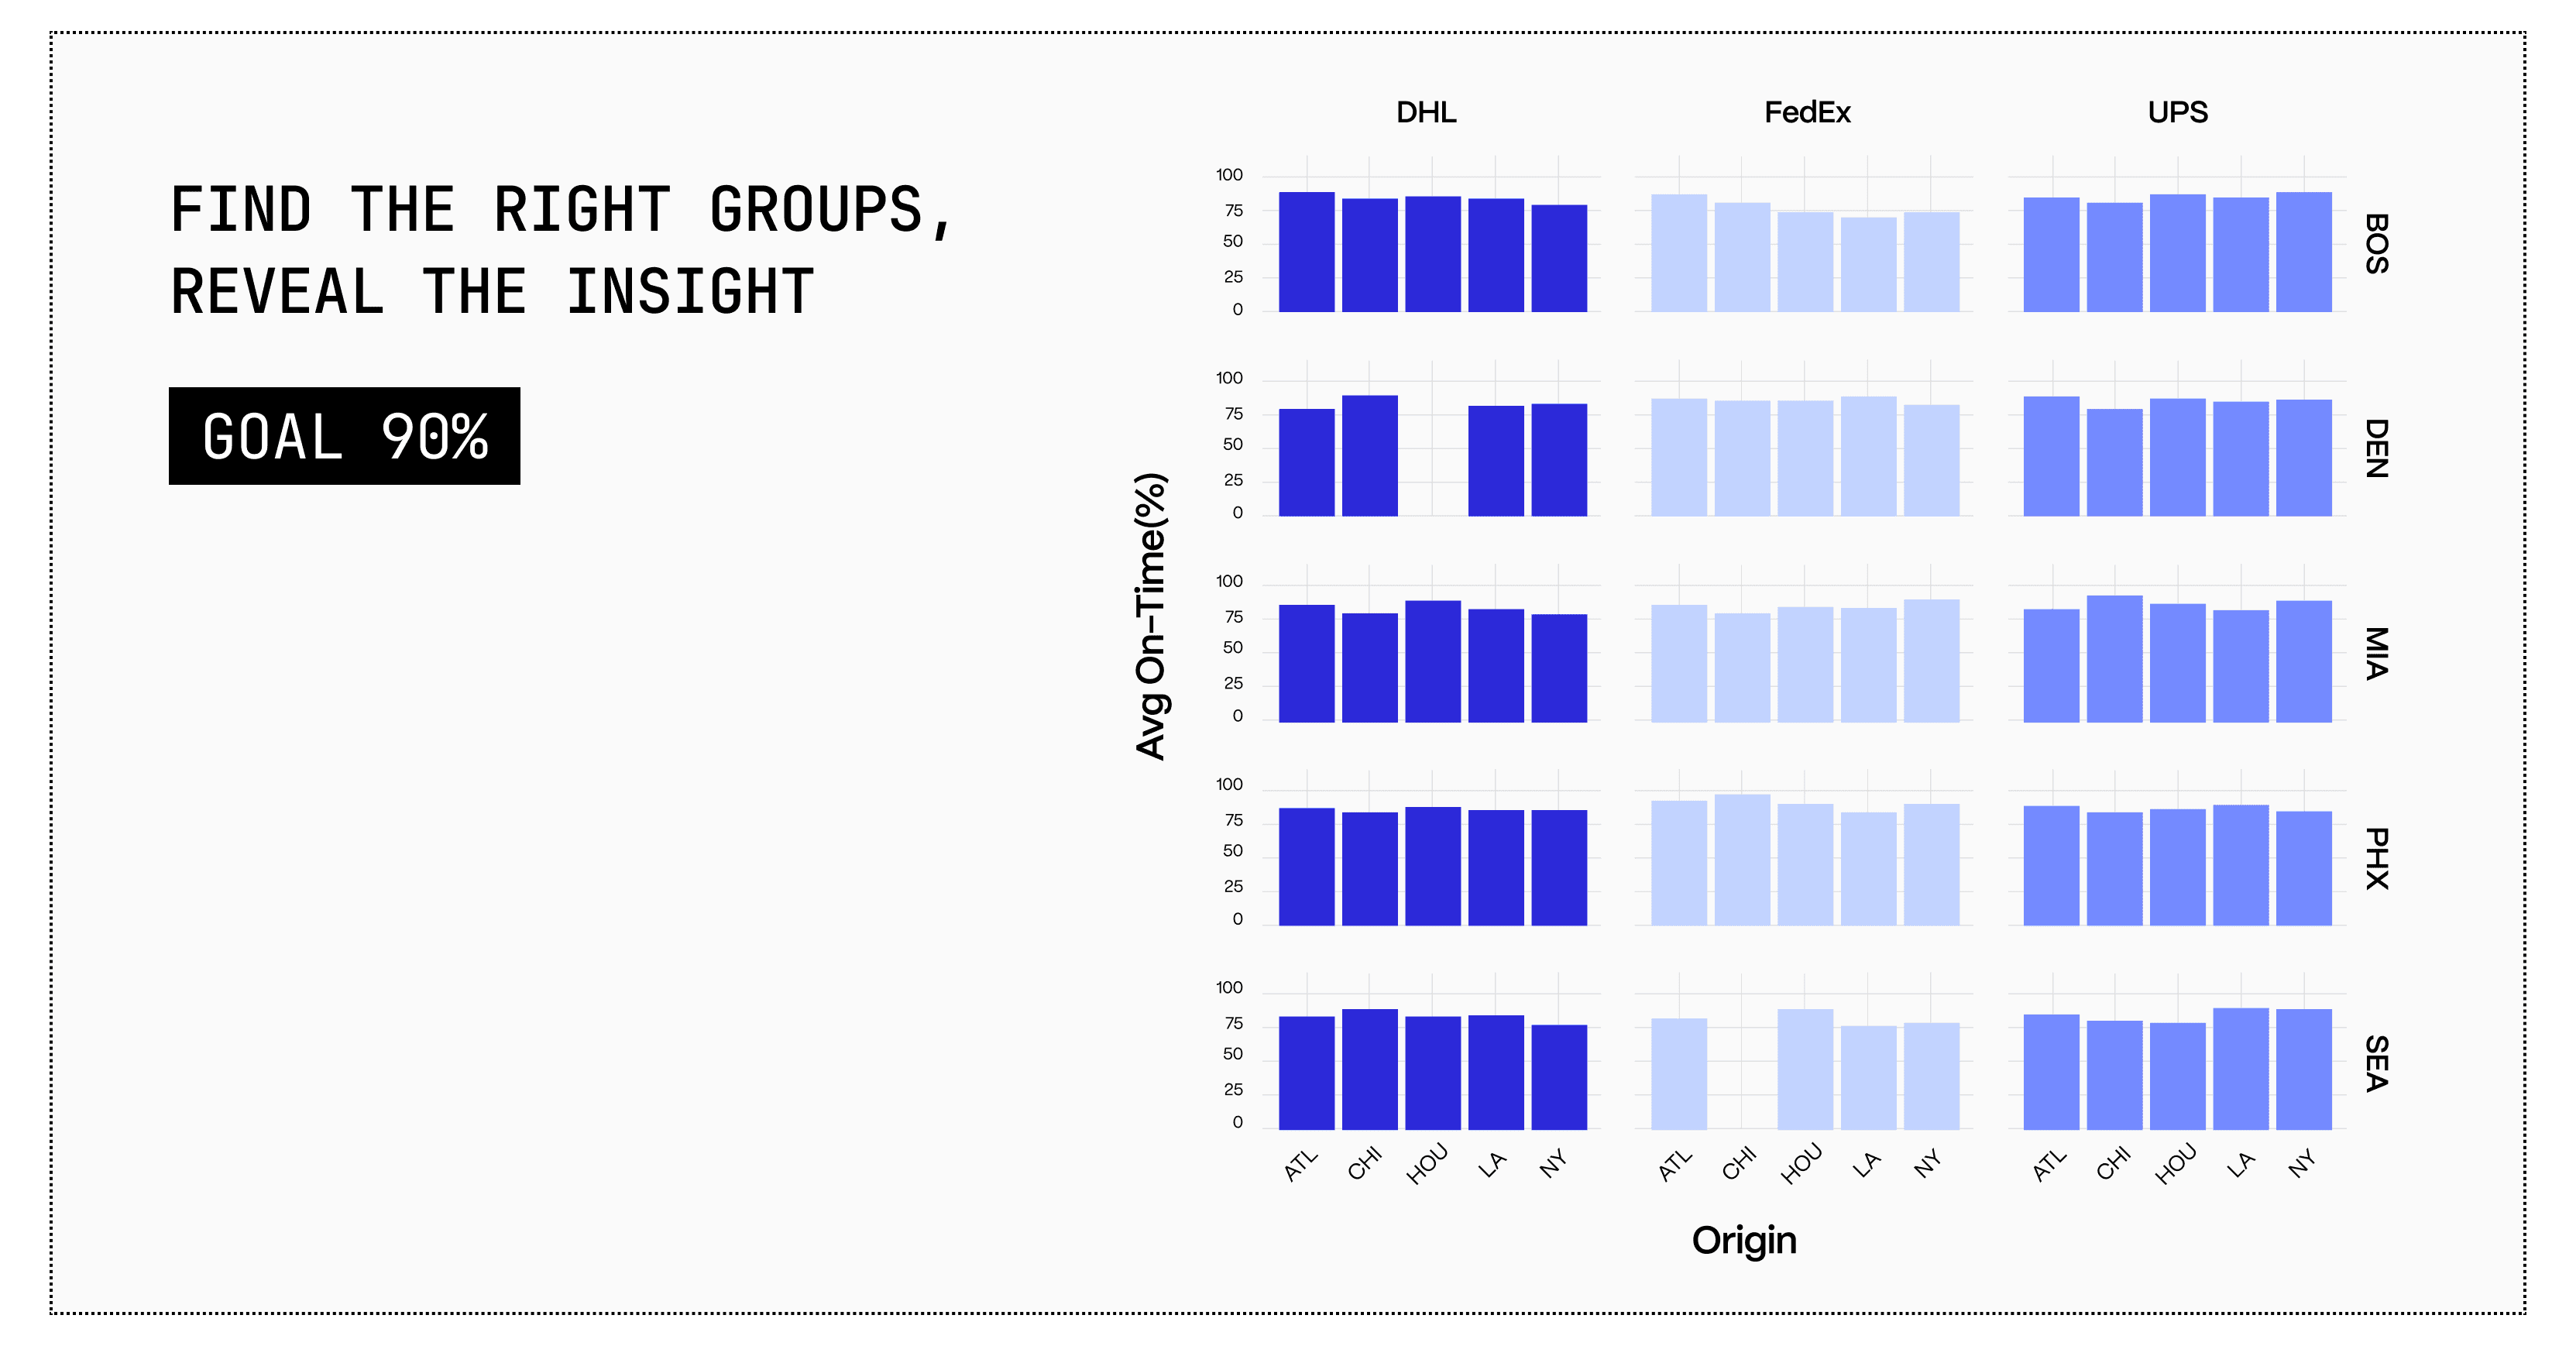
Each carrier, overall → everyone hits 90% on-time.
Break by carrier × destination → FedEx bleeds in BOS.
Nothing fancy.
Just correct framing.
This doesn’t stop at descriptive stats. In machine learning, groupby is a hero.
NVIDIA puts it plainly: feature engineering is still one of the most effective ways to improve tabular ML, and the most powerful feature engineering technique is groupby aggregations.
Translation: even modern models need you to decide the meaningful buckets.
Concrete example (with synthetic data):
Data columns: carrier, origin, destination, recent on-time rate.
Baseline model: random forest with default features ≈ 88% accuracy.
Add one feature: 30-day mean on-time for carrier x destination.
Same model, same params. Accuracy jumps to ≈ 89%. You handed the algorithm the right grouping. Signal unlocked.
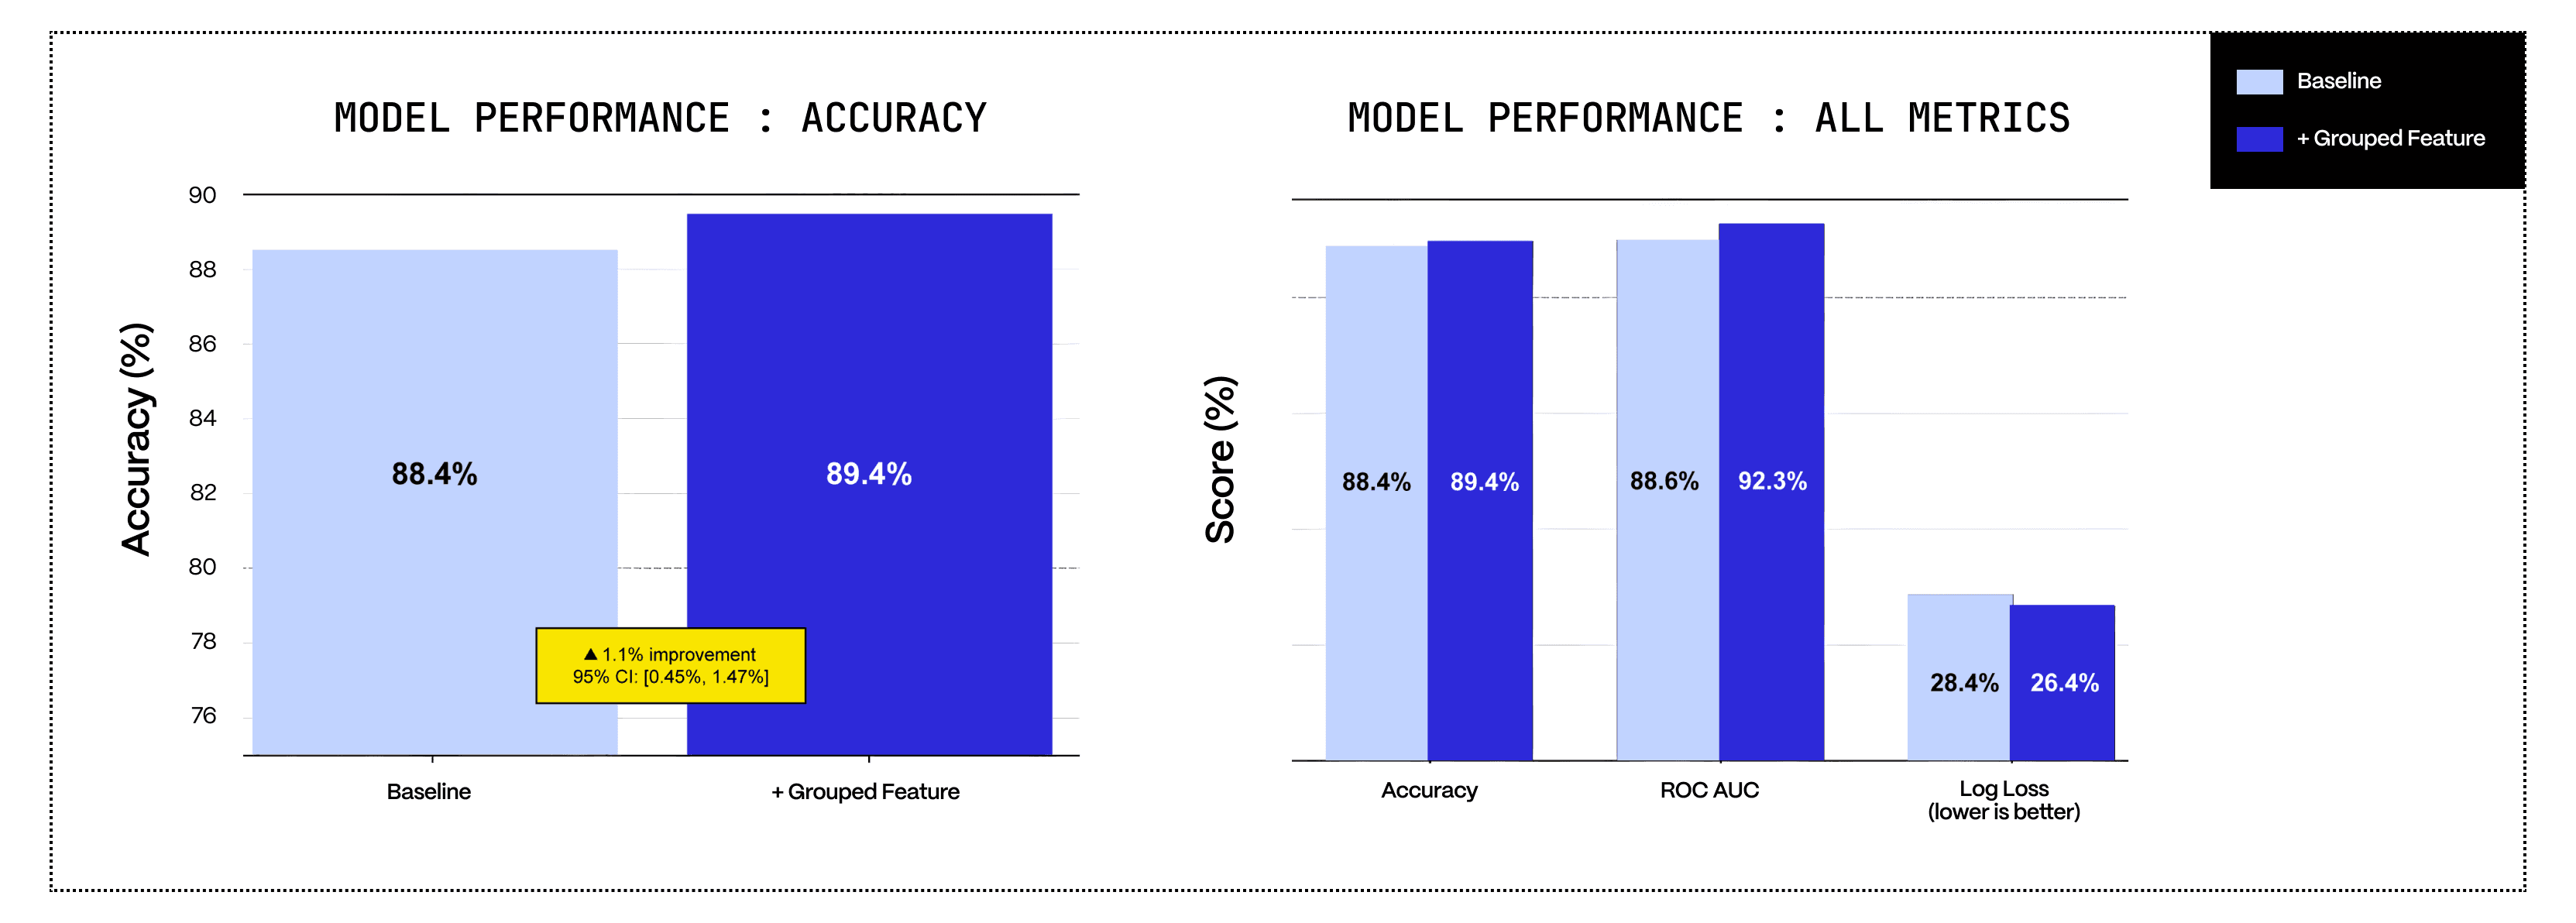
Only 1 percentage point?
1% better on $100M of inventory; that's $1M of potential savings. Either $1M of reduced OOS that increases revenue, or less carrying cost from obsolete/slow-moving inventory that never needed to come in.
You didn’t tune the model.
You didn’t collect new data.
All you did was give the machine the right world view.
Nearly free ROI.
But how? There are at least two paths to the right groups:
Brute force: when you have no intuition or have compute to burn.
Domain knowledge: when you understand the structure of the world.
The data didn’t change. The insight was there.
You just needed a different lens.
The way you group the world shapes the story your data tells. Used well, it’s a quiet kind of superpower.
Read more
Leadership & Decision Culture
The Counterpoint
May 27, 2026
Dinesh Natarajan
read more
Decision Intelligence
No Destination Stays Still
May 5, 2026
Brooke Collins & Sonja Jones
read more
Optimization Science & Modeling
Why Optimization Needs Simulation
Apr 14, 2026
Ratnaji Vanga
read more
Engineering Insights
The Real Reason Your Planning System Slows Down
Apr 13, 2026
Aditya Jaroli & Pradeep Vijayakumar
read more
Planning & Forecasting
Teaching Supply Plans to See Around Corners
Apr 6, 2026
Ugo Rosolia
read more
Planning & Forecasting
Why Your Planning Software is Holding You Back
Apr 1, 2026
Deb Mohanty
read more
Planning & Forecasting
Why Your Planning System Should Think Like a Perishable
Mar 23, 2026
Brian Howard Dye
read more
Planning & Forecasting
The Modeling-Planning Divide Was Always a Technology Problem
Mar 19, 2026
Vish Oza & Deb Mohanty
read more
Leadership & Decision Culture
The Innovation Tax: Why Your Best Work Doesn't Compound
Feb 18, 2026
Brittany Elder
read more
Leadership & Decision Culture
What Sudoku Teaches Us About Enterprise Software
Feb 17, 2026
Akshat Jain
read more
Decision Intelligence
Taming the Toughest Problems in Transportation
Dec 18, 2025
Amit Hooda & Priyesh Kumar
read more
Leadership & Decision Culture
Why 30% of Packaged Food Never Reaches a Consumer
Dec 22, 2025
Srivatsan Kadambi Seshadri & Thilak Satya Sree
read more
Leadership & Decision Culture
How to Plan When Nothing Goes According to Plan
Dec 15, 2025
Dr. Nilendra Singh Pawar
read more
Architecture & Composability
Why We Fall Back to Heuristics
Nov 24, 2025
Frank Corrigan
read more
Architecture & Composability
The Cost of Curiosity
Sep 24, 2025
Brooke Collins
read more
Leadership & Decision Culture
Lyric Named a 2025 Gartner® Cool Vendor in Cross-Functional Supply Chain Technology
Sep 2, 2025
Sara Hoormann
read more
Leadership & Decision Culture
Built for Builders. Backed to Scale.
Aug 5, 2025
Ganesh Ramakrishna
read more
Architecture & Composability
Generative AI meets Time Series Forecasting
May 2, 2025
Deb Mohanty
read more
Architecture & Composability
The Dying Art of Supply Chain Modeling
Apr 15, 2025
Milind Kanetkar
read more
Leadership & Decision Culture
Tariffs, Trade Wars, and the AI Advantage: Why Fast Modeling Wins
Apr 7, 2025
Lyric Team | Prime Contributors - Laura Carpenter, Victoria Richmond, Saurav Sahay
read more
Architecture & Composability
Lyric Leverages NVIDIA cuOpt to Elevate Supply Chain AI
Mar 18, 2025
Sara Hoormann
read more
Architecture & Composability
The Technology Behind Modeling at Scale
Mar 14, 2025
Ganesh Ramakrishna
read more
Leadership & Decision Culture
Our Dream is to Make Every Supply Chain AI-First
Oct 18, 2023
Ganesh Ramakrishna
read more
Architecture & Composability
What Is a Feature Store Anyway?
Mar 14, 2024
Sara Hoormann
read more
Leadership & Decision Culture
Supply Chain AI Ain’t Easy
Feb 20, 2023
Ganesh Ramakrishna & Sara Hoormann
read more
Decision Intelligence
Four Ways to Improve Supply Chain Operations with Machine Learning
Jan 26, 2023
Vish Oza
read more
Architecture & Composability
Prediction is the New Visualization
May 30, 2024
Frank Corrigan
read more